


Histograms can be found in almost any modern image editing software. It is my guess that most current digital cameras, including some compacts, can display histograms as well – some even live as you shoot using your LCD screen. Such persistent inclusion would suggest that histograms are quite important. Even so, many beginner photographers don’t seem to understand what they show. There is nothing wrong or shameful with that, as histograms may appear to be rather complex at first. Truthfully, they aren’t. In this article for beginners, I will try to teach you how to understand histogram. Hopefully, by the end of this tutorial, you will learn to “read” them and see if they are useful to your photographic needs.
General Understanding
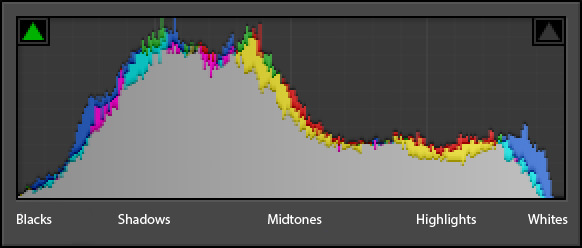
A histogram is a graphical representation of the tonal values of your image. In other words, it shows the amount of tones of particular brightness found in your photograph ranging from black (0% brightness) to white (100% brightness). As shown in the image above, dark tones are displayed on the left side of the histogram. As you move rightward, tones get lighter. The middle portion of the histogram represents midtones, which are neither dark nor light. Vertical axis of a histogram displays the amount of tones of that particular lightness. Histogram is exposure-dependent, but is also affected by tone curve and other settings.
Shadow and Highlight Clipping
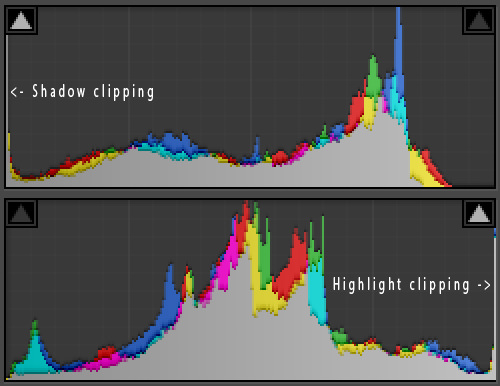
If a certain portion of the histogram is “touching” either edge, it will indicate loss of detail, also called clipping. Highlight clipping (areas that are completely white and absent detail) occurs if the graph is touching the right side of histogram. Shadow clipping (areas that are completely black and absent detail) occurs if the graph is touching the left side of histogram. Either case can be often fixed by altering exposure settings. However, you must remember that it all depends on the scene. For example, if there’s sun in your image, it is only natural it will be so bright – completely white, in fact – that highlight clipping will occur.
If you want to see whether there is any clipping as you photograph, engage histogram in your camera as you review images. Each camera is different – Nikon cameras, for example, usually require you to press navigator keys up or down a couple of times in review mode before the correct settings come up. Many current DSLR cameras have live histograms that react to scene in real time. To engage live histogram, you will need to use the LCD screen of your camera to photograph instead of optical viewfinder (Live View mode).
Should you notice any highlight or shadow clipping, alter your exposure accordingly: to save shadow detail, make images brighter by dialing in positive exposure compensation value (+0.3 or +0.7, for example); to save highlight detail, make images darker by dialing negative exposure compensation value (-0.3 or -0.7, for example). Exposure compensation is usually set using “+/-” button on your camera. If you prefer to shoot with manual settings, just change ISO, aperture or shutter speed accordingly. Read this article to learn about each of these three exposure settings.
Color Channels
Histograms usually display information for three primary colors – red, green and blue – and are known as RGB histograms. Such is the histogram shown above. You will notice that it consists of several diagrams marked with different colors. Three of these diagrams represent red, green and blue color channels accordingly. Gray diagram shows where all three channels overlap. Yellow, cyan and magenta appear where two of the channels overlap.
Histogram and Exposure
Some are used to seeing histograms as graphical representations of exposure. Quite a few photographers are thus used to evaluating exposure based on histograms alone and state them as either “good” or “bad”. Usually, a “good” histogram would render most tones in the middle portion of the graph, and no or few tones would be found at the extreme edges. A “bad” histogram would have tones at the very edges of the graph, which would basically mean either underexposure to the point of lost shadow detail (shadow clipping), or overexposure to the point of lost highlight detail (highlight clipping), or even both in a single image. If we agree with such an approach, the histogram shown at the top of this article would represent an image that is ever so slightly underexposed (tones are shifted slightly to the left), but mostly ok.
Let’s see if such a theory is correct by examining the following photograph. I used Lightroom to process three different virtual copies of it.
Underexposure
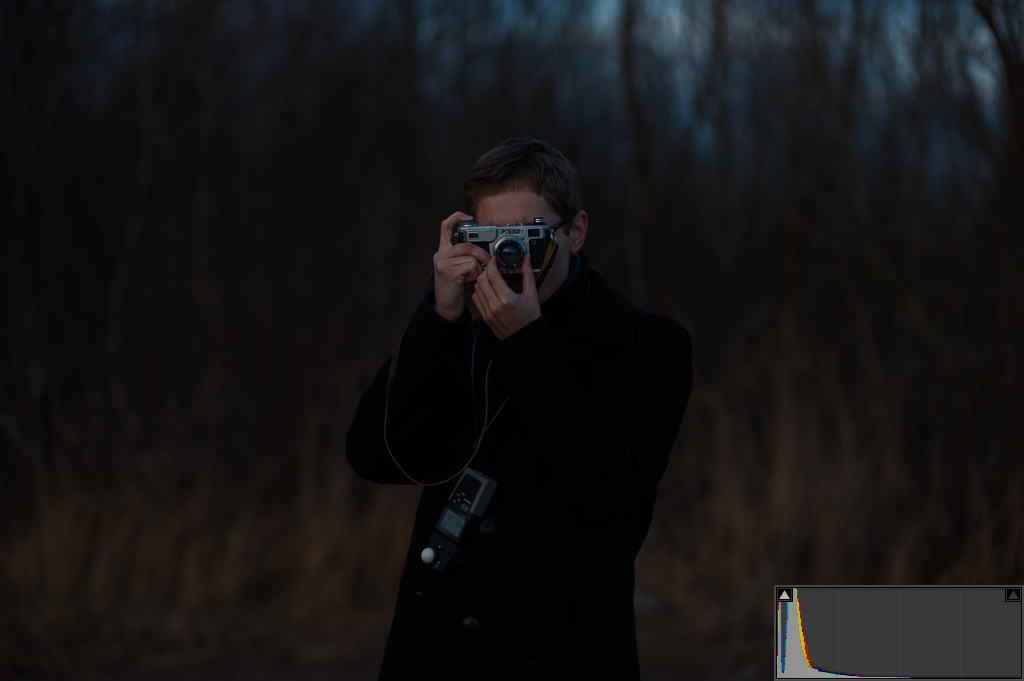
The first copy shows an underexposed photograph (too dark). As you can see, most of the image lacks any sort of bright detail. Histogram clearly shows a strong shift to the left side with most tones in the shadow range, and some are even clipped (completely black).
Overexposure
The following image is overexposed (too light). Many tones are very bright and there are basically no darker tones. A large portion of the image is blown-out (completely white) and bears no detail at all. As you can see, the histogram confirms that the image is much too bright – it is shifted strongly to the right.

Can you see a small amount of midtones displayed in the histogram? They represent my coat, which, in real life, is black. The tones of my coat should be shown at the left side of the histogram as “shadows” in a well-exposed image. Let’s see if that is true by looking at the following image. It is exposed correctly and bears a much broader tone distribution with most of them found in the “midtone” section of the histogram.
Correct Exposure

Let’s analyze the histogram of that last image. As you can see, there are barely any tones at the extreme left-side of the histogram, where blacks are shown, which means there is no detail lost in shadows. Then we see it spike – as mentioned earlier, this portion of the histogram shows the tones of my black coat. It is sufficiently dark, yet still bears enough detail. Note that the spike ends with blue channel – it represents the tones of my scarf. Moving leftward, we see a decrease in the amount of lighter-than-my-coat tones. Clearly, if we examine the photograph, the coat is more or less the darkest element of the photograph (along with the fake leather of my Kiev 4AM rangefinder). Any other portion of the image is significantly lighter.
Then we see our histogram spike up quickly again. These values represent the background, which is moderately bright and takes up the biggest portion of this particular photograph. Histogram confirms this. Gradually, as the tones get lighter, their amount decreases – that’s where information about the lightness of my face and sky is represented. Both these areas are small, but noticeably lighter than the background. Finally, we end up with a small amount of highlights. We can find them in the lightest portions of the sky as well as the camera I’m holding.
Should you Set Exposure using Histogram?
Based on these samples, a “good” histogram – one with most tones stored in the middle portion – does in fact indicate correct exposure. Does that mean histogram can indeed be used to judge exposure? Not quite. Let’s examine one more example with a completely different histogram to the “good” one shown earlier. It is a product shot of a couple of earrings.
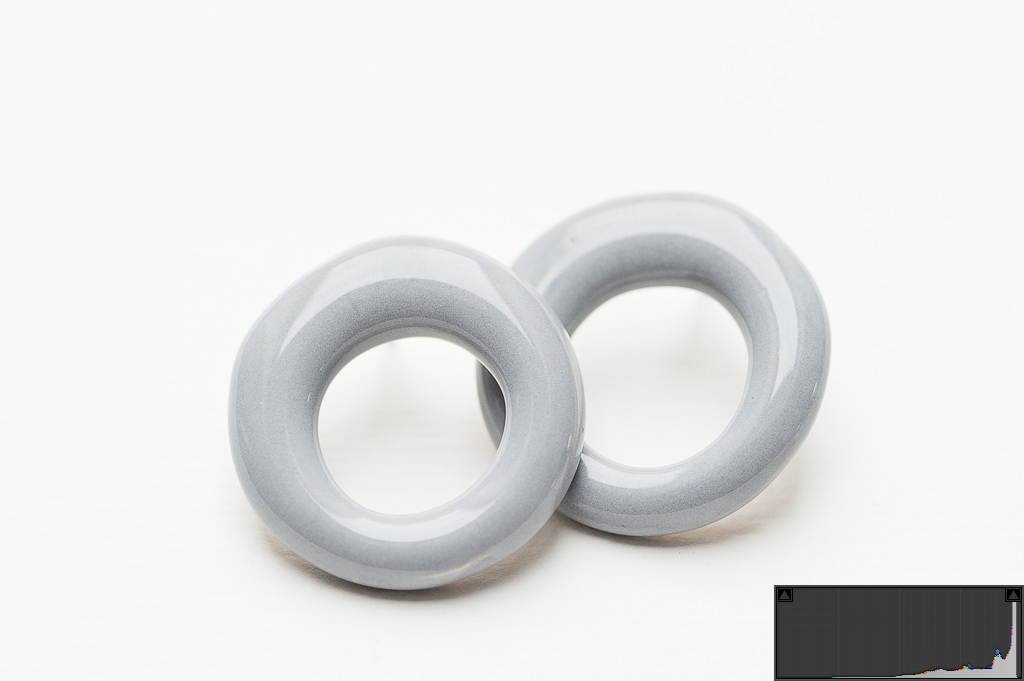
As you can see, histogram is shifted heavily towards the right where bright tones are represented. If you were to judge the exposure of this particular photograph based on the histogram alone, you would probably say it is overexposed considerably. There is barely any sign of midtones, let alone shadows. However, would you say that the image above is not exposed properly? Should I alter my exposure settings and aim for the “good” histogram, this photograph would be much too dark.
A simple conclusion can be drawn, then: the histogram is not necessarily good for evaluating your exposure. The “correctness” of it depends on too many factors, not the last of which is your vision as well as the scene you are photographing. Histogram merely shows you the amount of tones of various brightness levels in your image, and nothing more. It can be used to discover whether you have clipped any highlight or shadow detail at specific exposure settings. You can use it as a guide to avoid such loss of detail as you take pictures, and that is where histogram excels. As long as you keep that in mind, in general, there is no “good” or “bad” histogram.
Final Words
Some photographers made a habit of glancing at histogram on the back of their camera LCD screen after each shot – mostly to check whether there are any tones at the extreme edges that would indicate loss of detail in dark or light areas. However, I never seem to find enough time to do it myself. It doesn’t make you more of a professional if you use the histogram, but learning how to read it can be invaluable at times. Hopefully, this article helped you to understand what histograms show and how to read them. Perhaps, with time, you will learn to use them. And if you feel it may be an unnecessary step for you, there’s nothing wrong with that either.

